Super User

AN INTRODUCTION TO DATA-DRIVEN MODELLING & GRAPH CLUSTERING
Dr. Dante Conti
9.3.1 Summary
Nowadays when society is immersed at the era of Information and Communication Technologies, the presence of massive data in different fields and real-world applications has encouraged the use of Data Mining, Machine Learning and Artificial Intelligence approaches aimed to discover and extract non-trivial information from databases. These novel approaches are the result of multidisciplinary researches and advances associated to Applied Mathematics, Statistics, Computer Sciences, Engineering and Physics. Some authors mention the new era of Data Science and Data Scientists by referring to academic and professional profiles with skills focused on analytics, IT and multidisciplinary thinking to solve problems under the idea of knowledge discovery in databases.
Currently, the so-called data-driven models (DDM) are becoming more and more common. DDM is based on analysing the data about a system, in particular finding connections between the system state variables (input, internal and output variables) without explicit knowledge of the physical behaviour of the system. These methods represent large advances on conventional empirical modelling with many applications which include Finance, Marketing, Medicine, Management and Environmental Sciences and so on.
Job market is seeking for experts in Analytics. Most demanded profiles include mathematicians, statisticians and engineers. Some European and American universities already include data science and data modelling in their academic curricula for undergraduate and graduate programs in Applied Mathematics, Statistics and Systems Engineering and similar disciplines.
Data-driven modelling assumes the presence of a considerable and sufficient amount of data describing the underlying system. Data are used to perform basically tasks of classification, pattern recognition, associative & predictive analysis.
Under these premises, the objective of this course is to introduce students in data-driven
modelling. A brief overview of the concepts and methodology will be presented. Also, the main methods will be described with the support of specialized software (in this case R: A language and environment for statistical computing). An emphasis on classification and clustering will be presented in order to solve two real problems where data-driven modelling has been implemented with successful results: (1) detecting consumption patterns in urban water networks and (2) graph analysis in flow networks – A case study in air transport.
The course is designed to interact directly with the participants. Two sessions of lectures are scheduled (about 6 hours). The rest of the time will be reserved to solve real-problems under the basis of the Hydroinformatics application or/and the flow networks (graph theory) by supporting and coaching the participants.
9.3.2 Prerequisites:
Participants should have attended some previous courses in Operations Research or Linear Programming, Basic Statistics and some knowledge in computer software (R) is advisable.
For those with no R knowledge, an introduction to this software is available at:
• https://cran.r-project.org/doc/contrib/Paradis-rdebuts_en.pdf
• http://ocw.mit.edu/courses/sloan-school-of-management/15-097-prediction-machinelearning-and-statistics-spring-2012/lecture-notes/MIT15_097S12_lec02.pdf
• https://cran.r-project.org/web/views/MachineLearning.html
9.3.3 Software:
R: A language and environment for statistical computing
Available at:
https://cran.r-project.org/
Main packages to be used: igraph, igraphdata, randomForest, rpart, tree, e1071, Nbclust.
9.3.4 Scheduling:
9.3.4.1 Monday July 04th:Lecture 1
An introduction to Data-driven Modelling and main algorithms (3-4 hours). Afternoon (from 2 p.m. or 3 p.m.). Homework: some R examples and presentation of the first problem related to Water consumption patterns: (Milan – Italy & London U.K.)
9.3.4.2 Tuesday July 05th: Lecture 2
Graph Theory and Graph Clustering: emphasis on shortest path applications and max-flow min-cut (3-4 hours). Afternoon (from 2 p.m. or 3 p.m.). Presentation of the second problem related to Air transport in US airports. Homework: Practice of igraph:
http://kateto.net/networks-r-igraph
9.3.4.3 From July 06th to 08th
Coaching for participants and solving of the proposed problems. Participants will be divided in groups in order to facilitate the solution of the problems. My availability will be from 9.00 a.m. till 7 p.m.
9.3.4.4 Saturday July 09th
Final reports and oral presentations.
9.3.5 Languages:
Presentations and coaching activities will be in Portuguese. Bibliography is 100% English.
9.3.6 Bibliography:
It is necessary and advisable to read (or at least, a quick review) the following papers which will be used all the week long:
1) Survey: Graph clustering by Satu Elisa Schaeffer. Available at:
http://www.leonidzhukov.net/hse/2016/networks/papers/GraphClustering_Schaeffer07.pdf
2) Data-driven modelling: some past experiences and new approaches by Dimitri P. Solomatine and Avi Ostfeld. Available at:
http://jh.iwaponline.com/content/ppiwajhydro/10/1/3.full.pdf
3) Predictive models for forecasting hourly urban water demand. By Manuel Herrera et al. Available at:
https://www.researchgate.net/publication/223694461_Predictive_models_for_forecasting_hourly_urban_water_demand_J_Hydrol_3871-2141-150
MATHEMATICAL MODELS AND THE DISTANCE GEOMETRY PROBLEM
Professors: Weldon A. Lodwick and Carlile Lavor
The following outline is based on 4 hours per day for 6 days. There are two main objectives:
• Presentation the mathematics that is applied to distance geometry focusing on three distance geometry models, (1) The molecular distance geometry problem, (2) The distance geometry associated with robotic arms, and (3) The distance geometry associated with the sensor location problem;
• Providing participants “hands on” experience with mathematical modeling by actually working on an applied problem in distance geometry for this session.
9.2.1 I. Day 1 Topics – July 4
Introduction to the Mathematical Modeling Process (1 hour)
1. Generic problems requiring mathematical models
a. Power of mathematical models
b. Limitations of mathematical models
c. How to put together a mathematical model
2. Applied mathematics tools
a. Optimization
b. Linear algebra
c. Differential equation
d. Interval analysis (for enclosure methods and bounded uncertainty)
A Particular Mathematical Model – The Distance Geometry Problem (3 hours)
1. The general distance geometry problem
2. Anatomy and taxonomy of distance geometry problems
3. Overview of solution methods
a. Quadratic equation methods
b. Matrix methods
c. Optimization methods
d. Linear algebraic methods – Caley-Menger theory
4. Three applied distance geometry problems
a. Molecular structures
b. Robotic arm movement
c. Sensor location
9.2.2 Day 2 Topics – July 5
The Molecular Distance Geometry Problem (1 hours and 20 minutes)
The Robotic Distance Geometry Problem (1 hours and 20 minutes)
The Sensor Location Distance Geometry Problem (1 hours and 20 minutes *** After the end of day 2, participants are divided into 3 groups and will be choosing one of the three problems (or another distance geometry application that may be of greater interest to participants).
9.2.3 Day 3 Topics – July 6
Participants begin to work on their applied problems (2 hours)
Solution Methods and Algorithms Part I (2 hours)
1. Branch and prune
2. Matrix multiplication methods
3. Caley-Menger methods
4. Optimization methods
9.2.4 Day 4 Topics – July 7
Participants to work on their applied problems (2 hours)
Uncertainty and the Distance Geometry Problem (2 hours)
1. Modeling uncertainty – theory
2. Application of interval uncertainty in the distance geometry problem
3. The use of extra information to reduce the interval uncertainty
9.2.5 Day 5 Topics – July 8
Participants to work on their applied problems (2 hours)
Catching up and if there is time, look at solution methods for the uncertainty distance geometry problem. (2 hours)
1. Numerical methods for the interval distance geometry problem
2. Uncertainty reduction numerical methods.
9.2.6 Day 6 Topics – July 9
Participants meet in teams to prepare for their presentation in the afternoon – finalize slides, demonstrations (2 hours)
Presentations of results (40 minutes per team)
MATHEMATICAL MODELLING IN INDUSTRIAL AND APPLIED MATHEMATICS
Jonathan Evans
This course is designed to give an overview of the modelling process and provide a general procedural framework with the necessary mathematical techniques to approach problems arising in industrial and applied mathematics. Although the areas of industrial and applied mathematics is broad, large classes of problems arise within the continuum mechanics framework. It is these types of problems that this course is designed to provide skills to formulate, analyse, interpret and document in reports or research articles. The course is designed to be delivered as a series of 10 lectures. The emphasis will be on how to use the techniques on practical problems, with reference given to the underlying mathematical theory. The detailed syllabus is as follows:
9.1.1 Lectures 1&2: Example Case Study.
An introductory problem on heat flow in metal bars is presented. The objectives are identified and then the key physical process modelled mathematically. The main modelling steps of formulating a well-posed initial-boundary problem, with subsequent non-dimensionalisation, analytical solution identification, asymptotic and numerical analysis is then presented. Interpretation of results and limitations of the model are discussed together with the structure of an actual written report for the problem.
9.1.2 Lecture 3: Overview of the Modelling Process.
Identification of the key steps in mathematical modelling. Interpretation of the physical process in a mathematical model. The main steps to analyse the mathematical problem. Intrepretation of results and model refinement leading to the modelling loop cycle. Ideas of Occam’s razor, parsimonius problems, bottom-up versus top-down approach. Identification of research problems and their different types. Transfer of mathematical techniques and technology between different application areas. Structure for writing reports, articles and research papers.
9.1.3 Lectures 3&4: Non-dimensionalisation.
Scaling variables to remove dimensions. The reasons to non-dimensionalise a system of equations. Application of the approach to a sequence of example problems from classical continuum models. The examples are of increasing complexity, leading from ordinary differential equations to partial differential equations and free and moving boundary problems. Non-dimensionalisation of the Navier Stokes equations, identification of dimensionless groups. Buckingham-Pi theorem.
9.1.4 Lectures 5-7: Similarity Methods.
Scaling methods applied to ordinary and partial differential equations. Scaling reduction techniques for nonlinear ordinary differential equations, including equidimensional equations and scale invariant equations. Similarity methods applied to nonlinear partial differential equations e.g. nonlinear diffusion and moving interfaces. Identification of the similarity form. Introduction to Lie groups and analysis in the Lie-plane. Type I and II similarity solutions.
9.1.5 Lectures 8-10: Asymptotic Methods.
The method of matched asymptotic expansions. Boundary layers, including flow of a viscous fluid past a flat plate. Solution of the Prandtl boundary layer by the Blasius similarity solution. Lubrication approximation in the Navier-Stokes equations, exploiting small aspect ratio geometries and the derivation of slowly varying solutions. Thin-film equation under a hierarchy of driving forces from gravity, surface tension and a light plate. Nonlinear diffusion examples. Novel example of contact lens motion. Asymptotic techniques complementing numerical techniques.
9.1.6 References:
Mathematical Modelling:
1. A.B. Tayler “Mathematical models in applied mechanics”. OUP 1986.
10
2. A.C. Fowler “Mathematical models in the applied sciences”. CUP 1997.
3. E. Cumberbatch and A. Fitt “Mathematical Modelling: Case studies from industry”. CUP 2001.
4. J. Ockendon, S. Howison, A. Lacey, A. Movchan “Applied partial differential equations”. OUP 1999.
5. J. Crank “Free and moving boundary problems”. OUP 1987.
Similarity Methods:
1. L. Dresner “Similarity solutions of nonlinear PDEs”. Pitman Research Notes in Mathematics 88. 1983.
2. G.J. Barrenblatt “Scaling, self-similarity and intermediate asymptotics”. CUP 1996.
Asymptotic & Perturbation Methods:
1. C.M. Bender and S.A. Orszag “Advanced mathematical methods for scientists and engineers”. McGraw-Hill 1987.
2. E.J. Hinch “Perturbation methods”. CUP 1994.
9.1.7 Software:
1. MATLAB.
9.1.8 Case Study Problems:
Two Case Study Problems are available for small group/individual study:
1. Case Study 1: Haemodialysis Performance
2. Case Study 2: Silicon Oxidation.
The Problem Descriptions and Outline Suggestions are attached for each Case Study.
The Outline Suggestions are only one way to approach the problem, others may be valid.
The main points to address in building a model, obtaining a solution/results and writing a report/presentation are:
i. Problem background, description and mathematical formulation.
ii. Analysis i.e. non-dimensionalisation; analytical, numerical and asymptotic solutions.
iii. Results, interpretation, limitations, extensions.
Controle de Epidemias


Pesquisadores
Tiago Pereira da Silva, Stefan Ruschel e Serhyi YanchukUtilizando-se de bases de dados da própria OMS sobre a gripe A-H1N1, os pesquisadores estudam como extinguir a doença.
A população é dividida em três grupos: saudáveis, doentes e isolados. A partir de modelos matemáticos, são calculados os tempos ideais para identificação da doença até o isolamento. E o tempo de isolamento para a recuperação. É esse resultado da equação que irá definir as chances de controle, no modelo estudado.
A pesquisa mostra o delicado balanço entre a identificação dos indivíduos infectados e o sucesso do controle. A partir desses números, seria possível promover políticas públicas para gerar a infraestrutura necessária e o treinamento de profissionais.

Mapeamento da Correlação de Genes

Pesquisadores
André CarvalhoO trabalho, desenvolvido em parceria com a Universidade de Regensburg, ao sul da Alemanha, e também pelos pós-doutorandos peruanos Edwin Talavera e Soledad Llerena, da USP-São Carlos criou, pela primeira vez, uma ferramenta computacional que, usando técnicas de aprendizagem de máquinas e ciência de dados, permite identificar interações funcionais entre os genes quando se inibe um deles com algum tipo de produto químico/medicamento.
A pesquisa irá ajudar a universidade alemã no avanço do entendimento e tratamento do câncer, mas a metodologia pode ser aplicada para se entender outros distúrbios da regulação gênica e seus respectivos tratamentos.
Atualmente, não é possível saber, por exemplo, quais genes serão afetados quando a pessoa toma um medicamento, e isso acaba levando a vários efeitos colaterais - inclusive, pode levar a algumas doenças secundárias depois. Então, identificando exatamente a correlação e que genes estão sendo afetados por uma determinada droga, pode-se reduzir e até eliminar esses efeitos.
Plataforma de Avaliação Informatizada

Pesquisadores
Mariana Cúri e Seiji IsotaniInicialmente chamado Plataforma de Avaliação Informatizada (PAI), o sistema é diferenciado porque não apenas monta as provas, seleciona questões e as corrige automaticamente, mas incorpora módulos estatísticos e matemáticos que permitem que as avaliações sejam adaptativas, personalizadas para cada aluno. Conforme as respostas dadas pelo aluno na prova, é possível escolher uma próxima questão em um banco de dados mais adequada ao nível de dificuldade ou acerto dele, individualizando e aprimorando assim o conteúdo e dificultando as "colas".
O sistema já existente será aprimorado com a participação do grupo de Computação, possibilitando seu uso por outros docentes e também para avaliações de qualquer conteúdo, tais pesquisa de opinião ou marketing, não necessariamente provas ligadas à área educacional.

Curso de Robótica
Coordenação: Roseli Aparecida Francelin Romero
O CeMEAI organiza um curso de Robótica voltado para alunos de escolas públicas do Ensino Fundamental e Médio. O curso, que começou no dia 9 de abril, é dividido em quatro sábados e visa fornecer aos alunos os conceitos básicos necessários para tornar mais competitivas as equipes que participarão da Olimpíada Brasileira de Robótica, que será disputada entre junho e outubro de 2016. Além do CeMEAI e do ICMC, o Centro de Robótica de São Carlos (CRob) também colabora com o curso, que recebeu mais de 100 inscrições.


Campeonato de Jogos Matemáticos
O CeMEAI, juntamente à Matemateca, irá promover o 1º Campeonato Regional de Jogos Matemáticos do Estado de São Paulo no segundo semestre de 2016.
Nesse campeonato, os jogos escolhidos são: jogo 1, jogo 2 e jogo 3
Regras Jogo 1
Regras Jogo 2
Regras Jogo 3
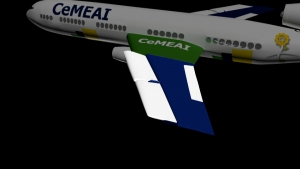
Superfícies Hipersustentadoras

Pesquisadores
João Luiz AzevedoAs superfícies hipersustentadoras são colocadas nas asas do avião de modo a aumentar a sustentação que as asas dão. Elas são utilizadas principalmente em pousos e decolagens e existem basicamente dois tipos: os flaps e os slats.
Os pesquisadores analisam quais mudanças podem ser feitas nos flaps e nos slats e simulam, no computador, o comportamento dos aviões com essas alterações nas asas.
A pesquisa analisa as superfícies hipersustentadoras porque, quando mais eficientes elas forem, mais o avião é beneficiado.
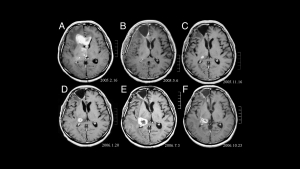
Diagnóstico de Esquizofrenia


Pesquisadores
Francisco Aparecido RodriguesO objetivo principal foi desenvolver um modelo matemático computacional que permite fazer o diagnóstico sem qualquer tipo de experimento invasivo. A partir de um scanner de ressonância magnética, é feito um mapeamento do cérebro e a análise dos dados das redes corticais.
A pesquisa já conseguiu identificar a diferença básica entre o cérebro de uma pessoa que tem ou não a esquizofrenia. Quando a pessoa tem a doença, o cérebro é menos organizado em determinadas regiões do que o de uma pessoa que não tem a esquizofrenia. São extraídas e analisadas 54 características e, por intermédio de um grafo, é possível afirmar com 80% de chance que trata-se de um paciente com o distúrbio.
Agora, o próximo passo é aplicar o mesmo método para diagnosticar outros tipos de doenças degenerativas como o autismo. E uma parceria junto ao Donders Institute (Instituto Holandês de Estudos do Cérebro) irá unir força neste trabalho.